Sophos wrong speed on dashboard
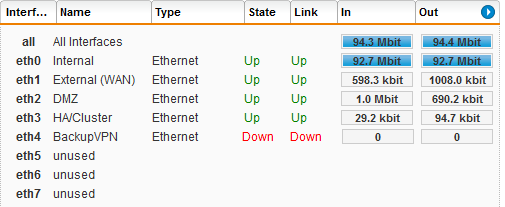
After logging on to the web interface, the dashboard is opened, which gives you a nice quick overview of the current status of you’re system. On a lot of systems there can be a strange value on the bandwidth usage bar, it is maxed out:

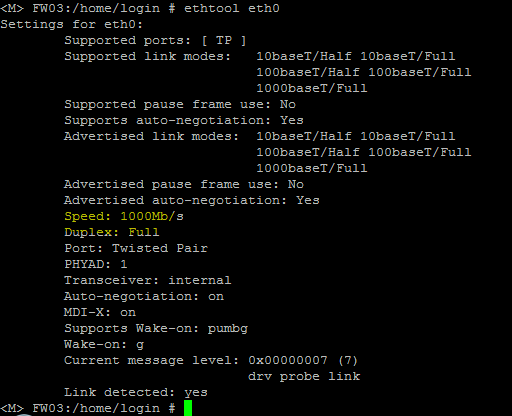
Don’t be alarmed, in most cases it’s only a misconfiguration of the displayed NIC speed First thing to know, at which speed is the NIC is really connected. If you don’t know or want to double check the speed of the interface. You can open a ssh or console session, login, su and execute ethtool ethxx (eth0 in this example)

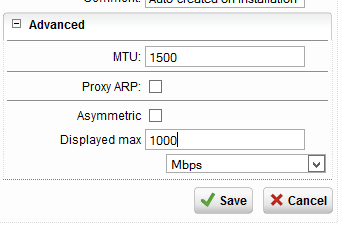
Look for the spee: xxxxxMb/s, edit the interface in interfaces & routing , Interfaces. expand advanced. The displayed max should be the same number as speed: xxxxMb/s.

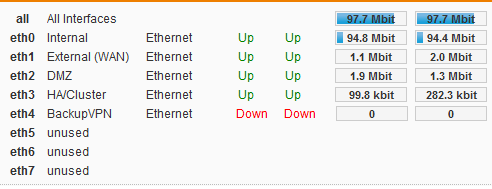
Save, the dashboard looks a lot better now:

If you make sure those displayed max values are correct for each interface, the meters will show a more realistic value. It’s purely a cosmetic change, since the values displayed in the meter bars are correct. But I like correct meter bars more 🙂
